V8 JavaScript Engine in Node.js: Architecture, Tiers, Shapes, and Deoptimization
We talked about v8 briefly in the previous chapter. We're going to go through it a bit more deeply in this chapter.
The v8 engine owns JavaScript execution, garbage collection, object layout, and JIT code generation. Node wraps it with system APIs, but the JavaScript inside your functions still runs under V8's rules. Those rules count most when ordinary code becomes hot.
Hot code means code that runs a lot while your app is handling requests or events. For example, let's say you have a request handler
app.get("/users", async (req, res) => { /* some logic */ });`.If
/usersgets called thousands of times, the code inside that route is hot code. So you can think of Hot code = code on a busy path that runs again and again.
To generate fast machine code, V8 relies on stable object shapes, i.e hidden templates it creates behind the scenes to track an object's layout. Because JavaScript is dynamically typed, objects don't have fixed schemas. V8 solves this by tracking the order and names of properties you add. When you create multiple objects that have the exact same keys assigned in the exact same sequence, they share a "stable shape." This predictability allows V8's inline caches to bypass expensive lookups and access memory locations almost instantly.
Also, passing mixed shapes into a function, changing array element kinds, using the delete keyword, manipulating the arguments object, or introducing repeated type changes disrupts this stability. These actions shatter V8's assumptions, forcing execution back down into lower, slower runtime tiers. While this process (known as deoptimization) preserves the correctness of your code, a hot path pays a massive performance penalty for losing its optimized code.
This chapter talks about that exactly: how V8 compiles JavaScript, how maps and inline caches feed the JIT compiler, how memory layout affects common operations, and which coding patterns keep your programs out of repeated deoptimization loops.
Runtime scheduling is the another runtime topic. Node.js event loop covers where callbacks, timers, and microtasks run after V8 gives control back to Node, and Node.js process lifecycle covers startup, active handles, signals, and shutdown around the same runtime.
How V8 runs JavaScript in Node.js
V8 processes your JavaScript source text by scanning tokens, parsing syntax, and generating bytecode for its interpreter, Ignition. As Ignition runs this bytecode, it actively records runtime feedback on your code's real-time behavior while tracking property lookups, function calls, math operations, array access patterns, and object shapes.
V8 uses this feedback to decide when code should scale up through its execution tiers or not.
First, Sparkplug quickly steps in to emit baseline machine code. If the path stays busy, Maglev leverages the gathered feedback to produce mid-tier optimizations. Finally, for the absolute hottest paths, TurboFan spends the extra compile time to generate highly specialized, high-performance machine code.
If your code later changes behavior and violates the strict assumptions built into that specialized code, V8 instantly deoptimizes and drops back down to a lower tier to keep running correctly.
V8 JavaScript engine architecture
The execution pipeline moves linearly from raw source text to highly optimized machine code, backed continuously by memory management. You can think of the path like this -
Parser -> Ignition -> feedback -> Sparkplug/Maglev/TurboFan -> deoptimization -> GC/object layoutIt begins at the parser, which translates your JavaScript source code into internal structures. From there, the Ignition interpreter takes over to execute the resulting bytecode while simultaneously logging detailed behavioral feedback directly into slots attached to the function.
This accumulated runtime feedback is then read by V8’s optimizing compilers - Sparkplug, Maglev, and TurboFan, each investing progressively more compilation effort to generate faster code. The highly specialized machine code they produce relies on strict guards protecting specific assumptions about object maps, element kinds, call targets, and value representations.
The moment a dynamic change causes these guards to fail, deoptimization triggers and shifts execution safely back down to a lower tier.
Beneath this entire pipeline sit garbage collection and object layout, managing the V8 heap model where everything in your code must ultimately live. It is easiest to understand how V8 manages this underlying heap space if you break it down into these five operations -
- Tracking object shapes groups similar objects together by mapping out the exact layout and order of their properties.
- Handling property stores physically writes and updates your data at precise memory locations whenever an object key is assigned.
- Managing array transitions dynamically reorganizes memory on the fly the moment a collection shifts from pure integers to a mix of types like strings.
- Allocating closures reserves permanent heap space for inner functions that need to keep variables from their outer scope alive.
- Housing boxed numbers wraps decimals and large values into dedicated memory objects, since only small integers can fit directly into standard pointers.
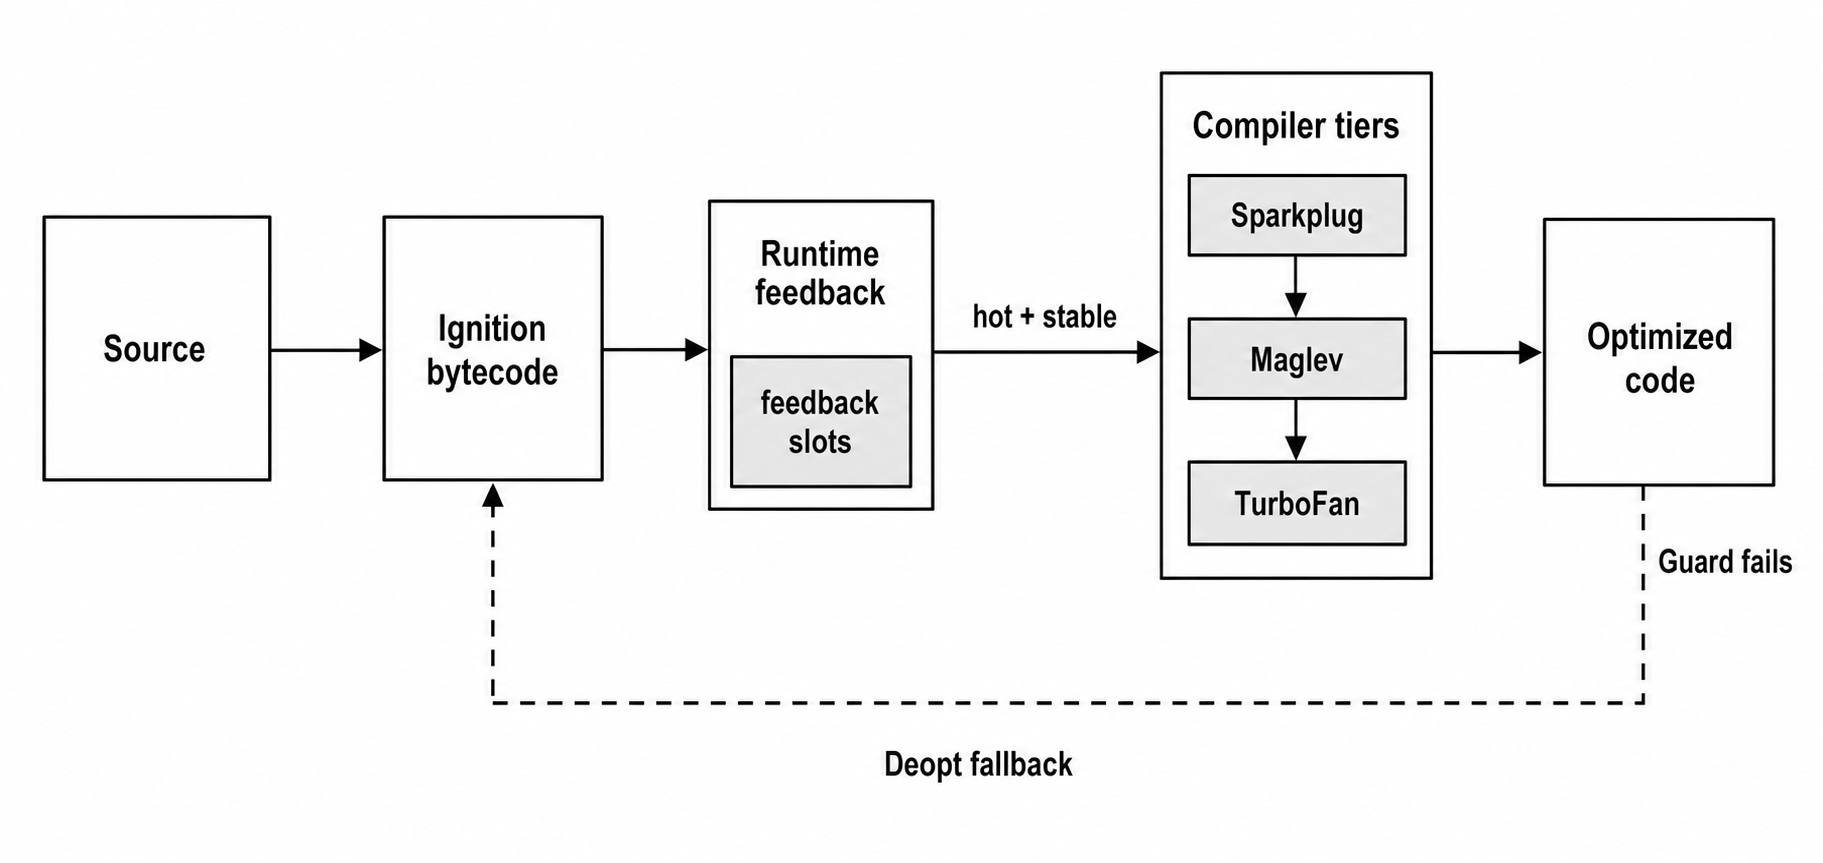
Figure 1.1 — V8 starts with bytecode execution, records runtime feedback, spends heavier compiler work on hot paths, and falls back when optimized assumptions stop matching.
A Deoptimization Case
Let's look at a common production failure mode, based on a real-world scenario. An API endpoint was responsible for processing configuration objects. It took a base setup, layered on user-specific overrides, and finally applied request-specific settings. The code was simple, clean, and completely correct.
However, after a recent deployment, the CPU usage for this endpoint spiked dramatically. While the team initially suspected I/O bottlenecks - like network latency or slow database queries - the profiler pointed directly to standard JavaScript execution.
The culprit turned out to be a seemingly harmless change. A new feature introduced a single conditional property to the configuration object -
if (condition) {
  config.optionalFeature = true;
}
Logically, this change didn't alter much. For V8, however, it completely transformed the underlying workload. Up to this point, the engine had recorded stable assumptions about the structure of the config object and had generated highly optimized machine code around that specific layout. By adding a property conditionally, the code suddenly introduced a brand-new object shape right onto the hot path.
The mistake here was treating a hot-path JavaScript object like an unconstrained hash map. While JavaScript allows you to freely alter object structures at the language level, V8 relies on a much stricter internal memory layout to keep execution fast.
The engine had placed a series of performance bets on the original structure of the config object. This optional property broke those assumptions, polluted the inline caches, and forced V8 to throw away its optimized code path. When writing hot code, you are always writing for two audiences - the developers who maintain the source code, and the engine that must execute its shapes over and over again.
Ignition, Sparkplug, Maglev, and TurboFan
Thinking of V8 as a basic line-by-line interpreter can lead to the wrong conclusions about performance. Instead, modern V8 keeps startup costs exceptionally low. It begins by observing how your code actually behaves at runtime, investing extra compilation time only after a function proves it runs frequently enough to deserve optimization.
This process always starts with parsing. V8 scans your raw source text to generate tokens, structures those tokens into an Abstract Syntax Tree (AST), and then translates that tree into Ignition bytecode - that we recently talked about. This bytecode serves as V8's compact instruction stream, running the code inside the interpreter while feeding vital behavioral data to the later compiler tiers.

Figure 1.2 — Source becomes bytecode before tiering decisions count.
While Ignition executes this bytecode, it populates tracking slots known as feedback vectors. These vectors record the real-world behavior of everyday runtime operations. Instead of just running the code, the engine takes detailed notes on how functions are called, how math operations behave, how arrays are accessed, and how object maps shift.
For example, when V8 encounters a lookup like obj.x, the recorded feedback goes far deeper than just saving the property name x. The engine tracks the specific internal map of obj, the exact memory offset used to locate x, and whether subsequent executions continue to match that identical layout.
Once that feedback is available, hot code can move upward -

Figure 1.3 — Current Node/V8 builds commonly expose Ignition, Sparkplug, Maglev, and TurboFan. Exact thresholds are V8 heuristics rather than a Node API.
Sparkplug is V8's fast baseline compiler. It skips speculative optimizations entirely and compiles Ignition bytecode directly into machine code. The primary goal here is early throughput - it removes the interpreter's dispatch overhead without forcing the engine to wait for a heavy, time-consuming optimization pass.
Maglev sits right between Sparkplug and TurboFan as a mid-tier optimizer. It builds a simplified control-flow graph and uses gathered runtime feedback to specialize common operations. This allows it to compile code much faster than the peak optimizer while still delivering a solid performance boost.
TurboFan represents the peak optimizing tier. It combines bytecode with runtime feedback to generate highly specialized machine code for the absolute hottest paths. For instance, if feedback shows that a specific property lookup has repeatedly encountered the same object map, TurboFan generates code that guards that map and uses a fast, fixed-offset memory load instead of running a full, expensive property lookup.
The compiler architecture behind TurboFan is highly sensitive to the version of V8 you are running. While older articles frequently describe TurboFan around a "Sea-of-Nodes" intermediate representation, that picture is outdated. V8 uses a framework called Turboshaft for TurboFan's JavaScript backend, though parts of the frontend pipeline still retain Sea-of-Nodes history.
For Node developers, the most important takeaway is the feedback-driven pipeline itself. V8 takes hot JavaScript, converts it into internal representations, specializes it based on real-world behavior, and throws that optimized code away the moment its assumptions are broken.
To keep your application responsive, V8 can compile this optimized code concurrently in the background, and Node exposes controls for these concurrent systems through node --v8-options. However, this tiering process isn't free as gathering feedback, running guard checks, managing internal bookkeeping, installing optimized code, and recovering from deoptimizations all introduce a real runtime cost.
On-Stack Replacement (OSR) handles functions that become hot while they are actively running. For example, a massive loop might start executing in the slow Ignition interpreter, cross an optimization threshold before the function actually finishes, and hot-swap execution over to optimized machine code mid-stream.
At the end, optimized machine code is fast because it is strictly conditional. It is tailored precisely around the specific maps, element kinds, and data types that V8 has already observed. The moment a future execution violates those exact assumptions, deoptimization triggers and throws the execution back to a lower tier while reconstructing enough internal state to ensure your JavaScript still runs perfectly.
Hidden Classes and Object Shapes
If you carry one V8 concept from this chapter, make it this one. Hidden classes (also called shapes, or maps in V8's source code) are the mechanism V8 uses to make property access on ordinary JavaScript objects fast. Many object-property optimizations rest on that mechanism.
Start with the language model, then look underneath it.
Maps, Not Just Dictionaries
At the language level, JavaScript objects look and behave like flexible key-value dictionaries. Under the hood, however, V8 avoids slow dictionary lookups by tracking object layouts using internal structures called maps.
Whenever you create an object, the engine assigns it a hidden class behind the scenes. This hidden class stores important metadata about the object's shape, including which properties exist, the exact order in which they were added, and where their values live in memory.
The following experiment shows this map transition behavior in action -
// Run with: node --allow-natives-syntax hidden-classes-demo.js
const obj1 = {};
const obj2 = {};
console.log(%HaveSameMap(obj1, obj2)); // true

obj1.x = 1;
console.log(%HaveSameMap(obj1, obj2)); // false

obj2.x = 5;
console.log(%HaveSameMap(obj1, obj2)); // true
At first, the two empty objects share the exact same internal map. The moment you add the property x to the first object, V8 shifts it to a brand-new map. Once you add that identical property to the second object, it follows the same transition path and safely reunites with the first object under a shared map.
V8 intrinsics like %HaveSameMap are internal, unsupported engine APIs. You should only use them for educational/learning experiments alongside the --allow-natives-syntax flag, and never include them in actual production code unless you have a valid reason to do so.
Transition Trees
To maximize efficiency, V8 creates a shared transition tree that allows multiple objects to reuse the same map pathway as long as they follow the exact same steps.
Imagine you create a blank object like const p1 = {}. V8 assigns it a base hidden class, which we can call C0. The moment your code executes p1.x = 5, V8 checks whether a rule for adding the property x already branches off from C0. If it doesn't find one, the engine generates a brand-new map called C1 and logs a transition: C0 + 'x' => C1. This new map records exactly where the value for x is located in memory.
When you add another property with p1.y = 10, the process repeats by creating another branch: C1 + 'y' => C2. If you later create a completely separate object and add x followed by y, that second object will step along this exact pre-built path and finish at C2. Because both objects now share the identical map, V8's optimizer can safely treat their underlying memory layouts as the same guarded structure.
The exact sequence of your assignments defines this path. If a different object adds y first and then x, V8 branches down an entirely separate transition chain. Even though both objects eventually end up with the exact same keys, their internal memory offsets are different, resulting in completely separate maps.

Figure 1.4 — Adding the same properties in different orders creates different map transition paths.
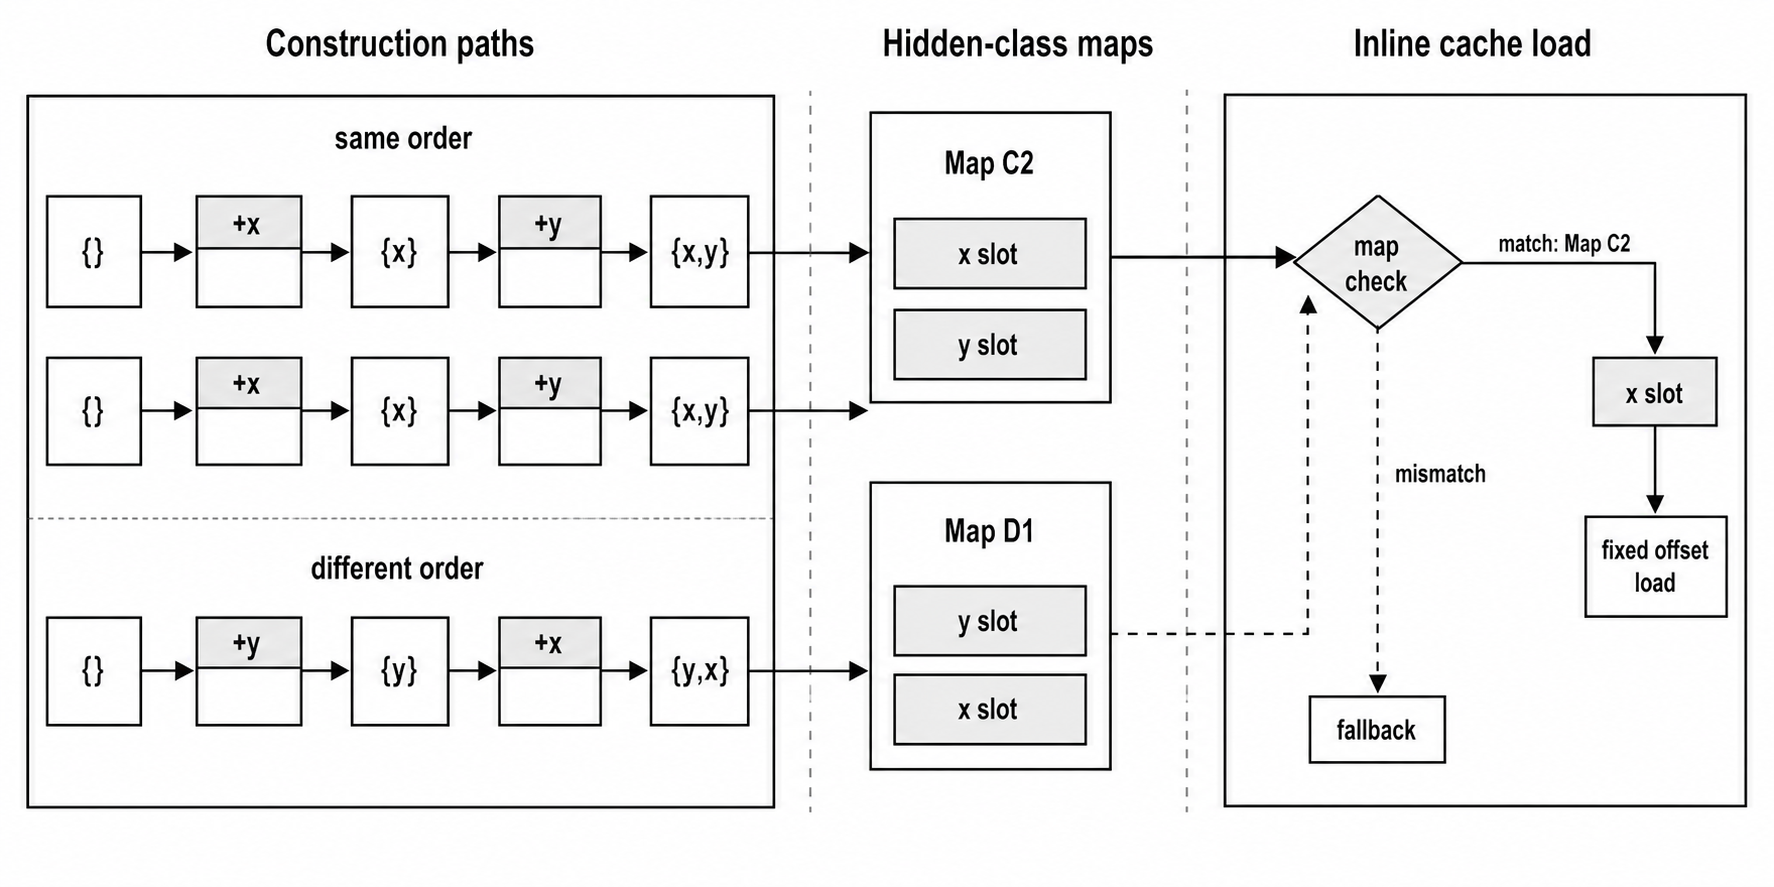
Figure 1.5 — Shared construction paths let objects reach the same map; a stable map gives an inline cache a guarded path to a known property slot.
The Config Object Failure Mode
The performance issue we discussed earlier typically happens in the code structured like this -
function createConfig(base, userOverrides, requestParams) {
  const config = {};
  Object.assign(config, base);
  Object.assign(config, userOverrides);

  if (requestParams.useNewFeature) {
    config.optionalFeature = true;
  }
  return config;
}
Because the properties inside base and userOverrides can arrive in a random order, and because optionalFeature is only appended under certain conditions, this function constantly creates a rotating door of different internal maps for objects that are logically identical.
When V8's optimized machine code later tries to read these configuration objects, it encounters too many structural variations. This causes the property-access sites to become polymorphic or megamorphic, which means the engine is forced to track multiple shifting layouts instead of a single, predictable shape. So, the compiler loses its stable memory offset and can no longer look up your data instantly.
The hidden-class split follows this visual path:

Figure 1.6 — A conditional property can split a hot object path into multiple maps.
To fix this for a hot configuration object with known fields, you should declare the full object layout upfront. Instead of appending new properties down the line, initialize everything first and simply update those existing fields later:
function createConfigV2(base, userOverrides, requestParams) {
  const config = {
    settingA: base.settingA ?? null,
    settingB: base.settingB ?? null,
    optionalFeature: false,
  };

  for (const [key, value] of Object.entries(userOverrides)) {
    if (Object.hasOwn(config, key)) config[key] = value;
  }

  config.optionalFeature = Boolean(requestParams.useNewFeature);
  return config;
}
By creating a stable layout right from the start, almost every configuration object generated by this function can share the exact same internal map.
The takeaway here is - the exact order in which you add properties directly determines whether V8 can maintain a high-speed execution path. You should always enforce this rigid layout pattern for hot data structures with a predictable set of keys. If you genuinely need a flexible container for dynamic or unpredictable keys, use a native JavaScript Map instead.
Pre-initializing every property stabilizes object shapes but can occasionally consume extra memory if your objects are exceptionally large. Reserve this technique strictly for data structures sitting on your application's hottest paths. For general-purpose code, always prioritize standard readability and maintainability.
Inline Caching and Monomorphism
Maps define how an object is laid out in memory, while inline caches (ICs) record how a specific operation behaves at a particular spot in your source code. Working together, they allow V8 to turn repetitive JavaScript actions into lightning-fast property lookups.
A call site is simply the exact place in your code where a runtime operation occurs. Take this example -
function getX(point) {
  return point.x; // Property access call site.
}

getX({ x: 10, y: 20 });
getX({ x: 30, y: 40 });
The line return point.x; represents a single call site. No matter which object gets passed into getX, V8 focuses on optimizing that specific property access location.
The first time this call site handles point.x, V8 must take a slow, generic path. It reads the object's map, searches the metadata for the property x, and finally loads the value from memory. Once this initial lookup is complete, V8 records what it learned directly at that call site. On the next execution, the engine can ask a much quicker question: does this incoming object match the previous map? If it does, V8 bypasses the lookup entirely and uses the cached memory location directly.
This feedback transitions incrementally through a small set of IC states -
| State | Meaning | Performance shape |
|---|---|---|
| Uninitialized | The call site has not executed yet. | V8 does not have any behavioral feedback to work with yet. |
| Monomorphic | The call site has encountered exactly one specific object map. | This is the fastest steady state for tracking property access. |
| Polymorphic | The site has encountered a small handful of different object maps. | V8 stays relatively fast by checking against a short list of known shapes. |
| Megamorphic | The site has seen too many different object maps. | V8 abandons specialization and falls back toward a slow, generic lookup path. |
The transitions move in a one-way progression:

Figure 1.7 — Inline cache states for a property access site.
In a polymorphic state, the optimized path becomes a short chain of map checks before giving up -

Figure 1.8 — A polymorphic inline cache checks known maps before falling back.
V8 Deoptimization
Deoptimization is the discarding of optimized machine code and dropping back to a lower compilation tier. It is a very common reason behind sudden, confusing CPU spikes on hot JavaScript execution paths.
The optimized machine code generated by Maglev and TurboFan is entirely speculative. It relies heavily on the type feedback collected while the interpreter ran the function. The moment one of those underlying assumptions is proven false at runtime, V8 must deoptimize to keep your code running correctly.
While V8 can deoptimize for many reasons, a few common patterns show up repeatedly:
| Trigger | What changes |
|---|---|
| Map mismatch | The optimized path expected a specific object map, but an object with a different structure reached the guarded code. |
| Changing array element kinds | An array transitions from a highly specialized layout - like packed small integers - to a generic layout containing mixed types. |
Legacy try...catch advice | Historical performance warnings about try-catch blocks often apply to the obsolete Crankshaft compiler rather than modern engines. |
arguments | The traditional array-like object is notoriously difficult for V8 to optimize, particularly if it escapes its original function. |
delete | Deleting a key from an object destroys its optimized shape, forcing V8 to fall back to a slow dictionary lookup layout. |
Modern V8 optimizes try...catch blocks much better than older versions did. Write your error handling for code correctness first, and only modify it if a profiler proves it is a performance bottleneck.
When you need a flexible collection of parameters, rest parameters (...args) are generally a much better choice than the legacy arguments object. Handling object deletions also requires careful thought. Setting a property to undefined (like obj.x = undefined) can preserve the object's stable shape, but it behaves differently than completely removing the key.
You should prioritize stable assignments on hot, fixed-shape objects if the property still needs to exist. Keep in mind that properties explicitly set to undefined will still be processed by Object.keys(), the in operator, and standard loops.
Caught Off Guard by BigInt Deoptimization
Let's look at another hypothetical example of how things can go wrong. Imagine you have an endpoint or a servie that simulates financial transactions was handling mostly regular numbers. But every now and then, it received massive amounts that needed perfect precision beyond the usual safe limits of a standard JavaScript number.
When running the app with debugging flags (node --trace-opt --trace-deopt simulator.js), the logs showed that a frequently used validation function was building fast code, then immediately throwing it away the moment the data format changed. The error message might say something like not a Smi - which just means "not a Small Integer" - or dependent field representation changed. The actual log looks like this -
[bailout (kind: deopt-eager, reason: not a Smi): begin. deoptimizing 0x... <JSFunction validateTransaction ...>]
The validateTransaction function made itself fast based on standard numbers, but that progress broke the moment a different type of value showed up. The logs pointed right to a line of code calculating the slippage on a crypto token trade.
The main problem here was type instability ie. meaning the type of data kept changing. Most transactions used normal numbers, but occasionally a massive token amount would come through. Regular JavaScript numbers lose accuracy when they get too big, so you have to use a BigInt to keep the math exact.
Turbofan only saw normal numbers at first, so it built fast code assuming everything would stay that way. The exact moment a BigInt showed up, it broke all of those assumptions and forced the engine to drop back to slow code. This triggers a frustrating loop - the engine builds fast code for normal numbers again, only for the next giant transaction to ruin it all over again.
This might end up being a painful cycle, that usually follows a predictable pattern -

Figure 1.9 — A hot path can repeatedly optimize and deoptimize when runtime feedback changes.
Enforcing Type Consistency
One way to fix this problem is to make sure all your data uses the exact same type. If you decide to convert everything to a BigInt, you have to get rid of regular decimal math completely. This is because mixing a BigInt and a normal Number together in the same math equation will cause JavaScript to throw a TypeError.
const rawTx = { value: "100000000000000000000" };
const value = BigInt(rawTx.value);
const slippage = value * 0.005; // TypeError
To solve this properly, you need a better approach. You can treat all money values as whole numbers that have been scaled up right from the start. This is actually a very common pattern in financial software to avoid the weird rounding errors that happen with standard decimals.
For instance, tracking your slippage in basis points keeps the frequently used function completely stable and predictable for V8:
const MAX_SLIPPAGE_BPS = 50n; // 50 bps = 0.50%

function normalizeRawTx(rawTx) {
  return {
    value: BigInt(rawTx.value),
    maxAllowedSlippage: BigInt(rawTx.maxAllowedSlippage),
  };
}
Now, the validation function gets the exact same BigInt data types every single time it runs:
function validateTransaction(tx) {
  const slippage = (tx.value * MAX_SLIPPAGE_BPS) / 10000n;
  return slippage <= tx.maxAllowedSlippage;
}
By passing the normalized data into validateTransaction, everything stays strictly as a BigInt inside your busiest piece of code. While BigInt math does have its own baseline performance cost, you have completely removed the constant flipping between different data types that was causing the engine to fail.
Using scaled-integer math is a reliable solution, but it does come with a trade-off. Working with a BigInt is generally slower than working with a regular Number when the values are small enough to fit safely into standard memory. For apps like these, the rock-solid stability you get is well worth that slight speed penalty. For other setups, you might find it better to split your code into two entirely separate paths instead.
The Dispatcher
A great way to handle this and keep your performance high is to use a dispatcher pattern. This simply means using a router function to sort incoming transactions and send them to the right place. By separating your logic, you can create two separate, specialized functions - one that only handles normal numbers, and one that only handles giant numbers. This keeps the data completely predictable for V8.
In this example, we check the incoming values and only send a transaction down the standard Number path if the data can fit there perfectly and safely:
const MAX_SAFE = BigInt(Number.MAX_SAFE_INTEGER);

function fitsNumberPath(value, maxSlippage) {
  return value >= 0n && maxSlippage >= 0n &&
    value <= MAX_SAFE && maxSlippage <= MAX_SAFE;
}
The dispatcher handles this check and converts the values right at the split:
function handleRawTx(rawTx) {
  const value = BigInt(rawTx.value);
  const max = BigInt(rawTx.maxAllowedSlippage);

  if (fitsNumberPath(value, max)) {
    return validateTransactionNumber({ value: Number(value), maxAllowedSlippage: Number(max) });
  }
  return validateTransactionBigInt({ value, maxAllowedSlippage: max });
}
Because of that quick check, each target function stays narrow and focused. Since the data types never change unexpectedly inside them, V8 can optimize both paths without getting confused.
function validateTransactionNumber(tx) {
  return tx.value * 0.005 <= tx.maxAllowedSlippage;
}

function validateTransactionBigInt(tx) {
  return (tx.value * 50n) / 10000n <= tx.maxAllowedSlippage;
}
Guarded Branches
If you want to keep all your logic inside a single function, you can use a simple typeof check. This splits up the work into two distinct paths under the hood. While V8 still has to handle multiple data types here, giving the engine a clear conditional branch is much easier for it to manage than mixing different kinds of math together out in the open. Just make sure to measure your code's performance before celebrating it as a guaranteed win.
function validateTransaction(tx) {
  if (typeof tx.value === "bigint") {
    const slippage = (tx.value * 50n) / 10000n;
    return slippage <= tx.maxAllowedSlippage;
  }

  return tx.value * 0.005 <= tx.maxAllowedSlippage;
}A single function that handles both BigInt values and regular numbers has to deal with multiple types. While this is usually perfectly fine, in extremely busy loops it can lead to slower or less stable performance compared to splitting the logic into two separate, single-type functions and choosing between them right at the start. Use a main dispatcher function for your "real" busiest paths, and stick to a guarded branch when keeping the code simple is more important than achieving maximum possible speed.
Memory Layout and Object Representation
To really understand how V8 handles performance, it helps to look at how JavaScript values sit inside your computer's memory. These behind-the-scenes details directly affect how fast V8 can find a property, handle numbers, and allocate memory.
V8 uses a clever trick called pointer tagging to instantly tell the difference between simple, immediate values - like small whole numbers - and pointers that lead to bigger objects in the memory heap. Depending on how your Node.js version was built, it might also use pointer compression, which packs these values into smaller 32-bit slots to save RAM.
Small Integers (SMI)
If a value is just a simple whole number, V8 can store it directly as a Small Integer - or Smi for short. This lets V8 completely skip the slower process of setting up a dedicated space for it in the memory heap.
The exact size of the number a Smi can hold depends on your specific Node build. On versions with pointer compression turned on, Smis usually hold up to a 31-bit signed number.
You can check your specific build settings by running node -p "process.config.variables". Look for flags like v8_enable_pointer_compression and v8_enable_31bit_smis_on_64bit_arch to see exactly how your local Node binary behaves.
Doing math with Smis is incredibly fast because V8 doesn't have to allocate heap memory or run constant type checks. This is exactly why integer counters and dense arrays of whole numbers are so friendly to V8's optimizer. Even so, it is always a good idea to profile your actual code before over-optimizing your loops.

Figure 1.10 — A Smi stores a small integer payload directly in a tagged value. Payload width depends on the V8 build.
Heap Objects
When a value isn't a simple whole number, its tag tells V8 that it is a pointer leading to the V8 heap. The engine uses heap objects to store more complex data like strings, arrays, normal objects, functions, and larger numbers.
To keep memory usage down, many builds use pointer compression, like we just discussed above. On these versions, even on a 64-bit machine, heap references are stored as compact 32-bit offsets inside a dedicated memory area. Other builds leave this turned off to prioritize larger heap sizes or different performance trade-offs.

Figure 1.11 — In pointer-compressed builds, a tagged pointer can be stored as a compact heap offset plus tag bits.
For example, a decimal number like 3.14 cannot be a Smi, so V8 wraps it inside a HeapNumber object and passes around a pointer to it.
But, V8's optimizer is smart. It can often avoid this extra trip to the heap by "unboxing" the number - storing its raw value directly inside another object's memory slot - or by using escape analysis to prove the number never leaves the function. While allocating heap memory takes time, the engine does everything it can to keep numbers unboxed and skip unnecessary steps.
Unboxing means V8 avoids putting a number inside a separate "box" object on the heap when it can safely store the raw number directly. Instead of storing a pointer to some extra number object, it keeps the actual numeric value right where it’s needed. This saves memory work and avoids an extra lookup, also the escape analysis helps V8 decide when that boxed object would never be needed, so it can skip creating it.
Object Layout in Memory
The moment you create an object, V8 finds and allocates a piece of heap memory for it. This block of memory always contains a pointer to the object's map, an elements pointer for indexed array properties, and slots for named properties.
To speed things up, V8 tries to store common properties right inside the object itself as "in-object fields." If you add too many properties, the extra ones get pushed to a separate backing store in memory, using layout blueprints managed by the object's map.
For an object like const p = { x: 1, y: 2 }, the layout looks like this:

Figure 1.12 — A simplified object layout with a map pointer and fixed-offset property fields.
When optimized code looks for p.y, it quickly checks the map, grabs the exact memory offset for y, and loads the value directly from that specific spot. Because the map guarantees where everything lives, a simple property lookup turns into a super-fast, direct memory load.
String Internalization
Strings have their own unique memory behaviors too. V8 uses a technique called string internalization for property names and text literals. This means V8 saves only one unique copy of a string in memory and shares it across your app. This saves RAM and lets V8 compare strings almost instantly by checking if they point to the exact same memory address.
Property names are a perfect example of this. If you have thousands of objects that all share a status property, V8 creates just one internalized status string object and shares it across all matching maps.

Figure 1.13 — A simplified view of a shared internalized property key. V8's actual string representations are more varied.
This entire memory model highlights why certain coding habits trigger specific performance behaviors. Small integers (Smis) are fast because they completely bypass the heap. Object maps are fast because they allow direct memory access via fixed offsets. On the flip side, using the delete keyword can ruin this setup by forcing an object out of this fast layout and turning it back into a slow, generic dictionary.
Common Performance Issues
When you're trying to tune the performance, you will see the same V8-related patterns over and over again. Just keep in mind that you should only investigate these fixes after a profiler confirms that JavaScript CPU usage is your actual bottleneck.
We've already talked about all of these, but just to give you a recap, I'll go through these once again. Bear with me.
Unstable Object Shapes (Hidden Class Explosions)
When code on a busy path creates objects with different property orders, different keys, or optional properties, it creates unstable shapes. If you look at a performance profile, the warning sign is usually a wide, flat flame graph. This shows your app spending a massive amount of CPU time just processing objects, even though no single function stands out as the problem. Under the hood, V8 is burning cycles checking a long list of different hidden classes.
For example, as we've already discussed, this pattern causes issues because the property is added conditionally -
const user = { name: "Ishtemet" };

if (isAdmin) {
  user.permissions = ["..."];
}
To give V8 a predictable, fixed shape, you should initialize all your fields up front with a default value and update them later:
const user = {
  name: "Ishtmeet",
  permissions: null,
};

if (isAdmin) {
  user.permissions = ["..."];
}
Polymorphic and Megamorphic Functions
Functions that are forced to handle many completely unrelated object structures are much harder for V8 to optimize. A single, generic utility function might look clean and elegant in your source code, but the property lookups inside it will get bogged down because the function is juggling too many different data layouts.
Here is a common example of a function trying to do too much at once -
function getIdentifier(entity) {
  return entity.id ?? entity.uuid ?? entity.productId;
}
When your profiling tools prove that this specific line is a bottleneck, you can solve the problem by splitting the work. Giving each function a single, narrow object shape to handle makes it much easier for V8 to speed up -
function getUserId(user) {
  return user.id;
}

function getProductIdentifier(product) {
  return product.productId;
}
Using delete on Objects
Advice about using the delete keyword depends entirely on what you are building. If you are creating a general cache where keys are constantly changing, a plain JavaScript object is usually the wrong tool for the job. Instead, you should use a Map because it is specifically built for frequent additions and deletions, and it handles missing keys much better.
const cache = new Map();

function setCache(key, value) {
  cache.set(key, value);
}

function evict(key) {
  cache.delete(key);
}
The trade-off changes when you are dealing with frequently used objects that have a fixed structure. If a property is part of a stable shape and you just want to clear its value, setting it to undefined will keep the optimized shape intact. But, if that property absolutely has to disappear completely - such as for a JSON serialization step, an in check, or an Object.keys() loop - then you should go ahead and use delete while accepting the small performance cost.
class RequestState {
  constructor() {
    this.user = null;
    this.trace = null;
    this.cachedResult = undefined;
  }
}
The two ways of clearing data look similar, but they do very different things under the hood:
state.cachedResult = undefined; // Keep the property structure intact.
delete state.cachedResult;      // Completely remove the property.
Testing this behavior in Node v24 confirms that an object keeps its fast internal layout when you assign a property to undefined. But the moment you use delete on a regular object, that fast layout is broken. Think of this as a helpful behind-the-scenes look at how V8 works, rather than a strict rule you must always follow.
Mixing Element Kinds in Arrays
V8 also optimizes arrays based on the specific types of data they hold. It categorizes array storage into different "element kinds" -
| Element kind | Meaning |
|---|---|
PACKED_SMI_ELEMENTS | A solid list containing only small integers. |
PACKED_DOUBLE_ELEMENTS | A solid list containing numbers with decimals. |
PACKED_ELEMENTS | A solid list containing a mix of objects, strings, or other regular items. |
HOLEY_ELEMENTS | An array that contains empty or missing slots, like const a = [1, , 3]. |
DICTIONARY_ELEMENTS | A slower, sparse layout used when array indexes are scattered far apart. |
If you start an array with integers like [1, 2, 3] and later use push("hello") (not sure why in the world would you do that?), V8 is forced to convert how that array is stored in memory, moving it from a fast integer layout to a more general layout. These transitions almost always move in one direction - from specific types to more general types - though V8 did add a rare exception to this rule for Array.prototype.fill.
This performance issue mostly shows up in heavy loops where an array is read or written thousands of times. Regular, everyday array code will run completely fine, but performance-sensitive math operations will get a big boost from keeping array data types consistent.
Mixing different types of data in an array forces V8 to reorganize its memory storage, which can slow down heavy loops. 90% of Node developers won't even notice the impact as most of us are building simple CRUD apps, where the bottleneck is probably the DB, but keeping your array data types consistent matters a lot when processing large amounts of data or doing intense math.
V8-Friendly Hot-Path Patterns
Code that runs frequently works best when your data structures and functions stay completely predictable. You do not need to write overly complex code to make it fast the way you can do micro-optimisations in C/C++/Rust, you just need to give V8's optimizer steady, reliable feedback.
The V8-Friendly Code Pattern
Using a standard class constructor makes sure that every object you create shares the exact same internal map from the start -
class DataPacket {
  constructor(id, timestamp, payloadType, payload) {
    this.id = id;
    this.timestamp = timestamp;
    this.payloadType = payloadType;
    this.payload = payload;
  }
}
Once your objects are uniform, you want your frequently used functions to be focused enough that they only deal with that single object shape -
function processPacket(packet) {
  const id = packet.id;
  const type = packet.payloadType;
  let score = id % 2 === 0 ? 1 : 0;

  if (type === "USER_EVENT" && packet.payload) {
    score += packet.payload.priority ?? 0;
  }
  return score;
}
How you create these objects also plays a huge role in performance. Creating objects repeatedly through the same class or factory keeps their shapes identical, allowing a later loop to process them at maximum speed -
const packets = Array.from(
  { length: 1000 },
  (_, i) => new DataPacket(i, Date.now(), "USER_EVENT", { data: "..." })
);

for (let i = 0; i < packets.length; i++) {
  processPacket(packets[i]);
}
Optimization Checklist
Always measure performance before modifying your code -
- Avoid guessing by using tools like
--profor the Chrome DevTools inspector to pinpoint the exact paths that are actually draining your CPU. - Focus your energy exclusively on the tiny handful of functions that completely dominate your performance profile.
- Inspect the incoming data for those busy functions to verify if your object maps and array types are staying perfectly stable.
- Run local experiments using the
%HaveSameMap(a, b)tool alongside the--allow-natives-syntaxflag to confirm that your objects truly share an internal map. - Trace your deoptimizations by running your code with
--trace-deoptand filtering for your function name to see exactly why V8 is tossing out your fast code. - Refactor your code for predictability by initializing all known fields early, using a single constructor path, splitting up mixed object shapes into separate functions, and keeping your arrays uniform.
- Measure your changes a second time with the profiler to ensure you only keep your updates if the actual performance cost drops.
V8 Flags and Runtime Options
Node.js gives you access to built-in V8 flags that let you tweak, debug, and look under the hood of the engine. Because the engine updates frequently, the available options might change. You can see the full list for your current version by running node --v8-options.
Informational Flags
These flags won't change how your application actually behaves, but they will output helpful diagnostic details while it runs -
| Flag | Use |
|---|---|
--trace-opt | Logs when code gets optimized, showing you when Maglev or TurboFan step in to speed things up. |
--trace-baseline | Logs baseline compilation from Sparkplug. This output can be quite cluttered because Node.js itself uses V8 to load. |
--trace-deopt | Logs when the engine has to drop back to slow code, including the function name, exact line, and reason. |
--log-ic | Logs inline cache state changes. Node uses this instead of the older --trace-ic flag. |
--trace-gc | Logs garbage collection events, showing how much memory was cleaned up and how long the app paused. |
Behavioral Flags
These flags actually change how V8 runs or optimizes your code, so you should use them carefully -
| Flag | Effect |
|---|---|
--allow-natives-syntax | Lets you use internal engine functions (starting with %) for testing. Never use this in production code. |
--optimize-for-size | Tells V8 to be careful with big optimizations to save on memory. |
--max-old-space-size=<megabytes> | Sets the maximum limit for your application's main memory heap. |
--jitless | Disables all fast Just-In-Time compilation tiers, forcing the app to run slow to save memory or meet strict security rules. |
How to Use Flags
To use these flags, make sure to pass them to the node command before your script's filename -
node --trace-deopt --max-old-space-size=4096 my_crud_server.jsYou can also set some flags using the NODE_OPTIONS environment variable, but only if Node.js permits them. While memory management flags like --max-old-space-size are perfectly fine, Node.js blocks many of the deeper debugging flags from being used this way. For example, trying to pass NODE_OPTIONS="--trace-deopt" will result in an error.
For example -
export NODE_OPTIONS="--max-old-space-size=4096"
node my_app.js
These tools are very useful when your performance profiling shows that your CPU is struggling with JavaScript work. They work alongside standard profiling tools to tell you exactly why a busy function is running fast or why it suddenly slowed down.
Historical Context
Back in 2017, V8 swapped out its old architecture for the modern Ignition and TurboFan setup. This is important because a ton of old Node.js performance tips floating around the internet date back to that older era.
The previous engine had major limitations with modern JavaScript features and error handling. For example, the common advice to never use try...catch blocks in busy functions comes entirely from that old system. In modern V8, error handling is highly optimized, so you should always write clean, correct code first and only change it if a profiler proves it is causing a bottleneck.
Later on, Sparkplug and Maglev were introduced to bridge the performance gap between raw bytecode and peak optimization. Today, V8 handles code efficiently by starting small, gathering real-world data, and investing heavy compilation time only where the traffic justifies it. If things change later on, it simply drops back down and restarts the process without breaking your app. You must have already noticed that V8 is a marvel of engineering.
Profiling Discipline for Hot Paths
When you know what properties a hot object will have, always use constructors, classes, or factory functions to create it. Make sure to initialize all of those properties in the exact same order every single time, even if some of them start out as null or undefined.
Try to write your hot functions to expect a single, predictable object shape. While it might be convenient to create a flexible utility function that accepts user objects, product data, database rows, and API payloads all at once, that abstraction often becomes a performance bottleneck. Instead, look at your profiling data. If a specific function is dealing with too many different shapes, split that hot work into smaller, specialized functions.
Keep your math paths type-stable. Smis are incredibly fast. Use BigInt when you absolutely need perfect precision for massive integers, but be sure to avoid mixing regular numbers and BigInt values inside the same hot calculation path.
If you need a dictionary or a cache where keys are constantly being added and removed, use a built-in JavaScript Map alongside its Map.delete() method. If you are working with an object and want to keep its shape intact, clear a value by setting obj.prop = undefined instead of deleting the key entirely. Only use the delete keyword on an object when you specifically want to alter its underlying structure.
Always base your optimizations on actual evidence. Start by gathering data with node --prof, the Chrome DevTools inspector, or another CPU profiler. Only turn on heavy flags like --trace-deopt after your profiler confirms that JavaScript execution is actually hogging your CPU. From there, you can trace the function names and bytecode offsets back to your source code. Keep in mind that a deoptimization reason is just a helpful clue from your current V8 version, not a permanent rule.
Appendix for V8 Profiling Commands
A quick reference for the commands used most often -
Basic CPU Profiling:
# 1. Generate the V8 log file
node --prof my_app.js

# 2. Process the log file into a human-readable report
node --prof-process isolate-XXXX-v8.log > profile.txt
Remote Debugging and Profiling with Chrome DevTools
# Run your app with the inspect flag
node --inspect my_app.js

# Or break on the first line
node --inspect-brk my_app.js
Then open chrome://inspect in Chrome.
Tracing JIT Compiler Behavior
# See what gets optimized
node --trace-opt my_script.js

# See what gets deoptimized
node --trace-deopt my_script.js

# Log inline cache state changes to an isolate-*-v8.log file
node --log-ic my_script.js

# Give the IC log a recognizable filename
node --log-ic --logfile=ic.log my_script.js

# Combine and filter for a specific function
node --trace-opt --trace-deopt my_script.js | grep "myHotFunction"
Note that the final command is a Unix shell example. If you are using PowerShell on Windows, use Select-String instead of grep.
The --log-ic flag writes specific internal engine logs like LoadIC or StoreIC to a file. The resulting filename usually starts with an address prefix, like isolate-0x...-ic.log. For a deeper analysis of these files, you can use V8's official tools/ic-processor utility from a V8 source checkout that matches your runtime version.
Using V8 Intrinsics for Benchmarking and Debugging
# Must be run with --allow-natives-syntax
node --allow-natives-syntax my_benchmark.js
Popular internal tools include %HaveSameMap(obj1, obj2) to check if objects share a shape, %GetOptimizationStatus(func) to see current performance tiers, and %OptimizeFunctionOnNextCall(func) to force immediate optimization.
At the end of the day, V8 rewards boring code. Stable object shapes, predictable arrays, and consistent call sites give the engine the steady feedback it needs to build blazing-fast machine code. On the flip side, hot code that keeps shifting its data structures spends all its energy falling back to the interpreter, recompiling, and trying to recover.